My Smart Volume Profile – Fixed
Title: 🔹 My Smart Volume Profile – Fixed
Description:
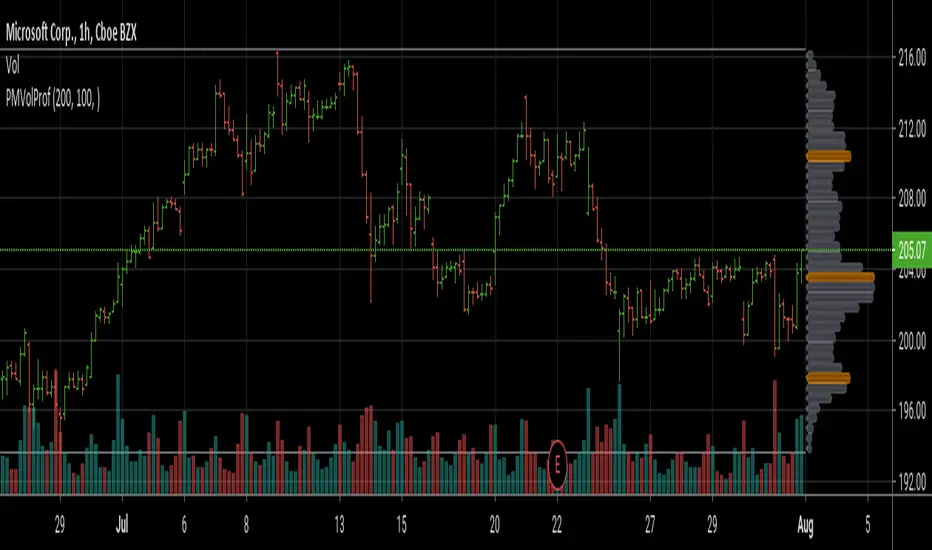
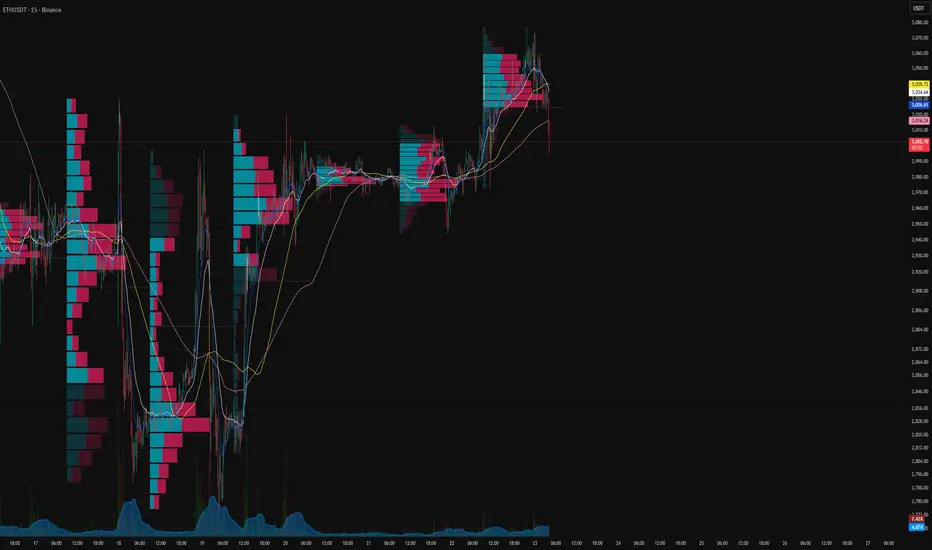
Lightweight custom Volume Profile showing POC, VAH, and VAL levels from recent bars. Highlights the value area, marks price touches, and supports optional alerts.
Developer Note:
Created with precision and simplicity by Magnergy
Penunjuk Pine Script®